
How to Track Organic Traffic During GA4 and Cookie Bar Times?
The last two years have seen two significant events hit web analytics on SEO projects. The first is the obligation to request visitor consent to store cookies even when tracking anonymized traffic. The second is the shutdown of Universal Analytics (Google Analytics 3, also called GA3) and the virtually forced switch to Google Analytics 4 (also called GA4).
Both of these things have, in most cases, had a significant impact on the ability to track organic traffic from search, with these changes making it most difficult to compare year-over-year traffic trends..
Year-over-year comparisons are often crucial when evaluating traffic trends because they better reflect seasonal fluctuations.
Google Analytics 4 measures more accurately
GA4 is a very different tool from its forerunner, not only in its interface but especially in its technical background. In principle, it should provide slightly more accurate data.
For example, in cases where a visit (session) took place on the edge of days, GA3 recorded this as one visit for the day it started and one for the next day it continued. GA4 correctly reports such a phenomenon as only one visit.
Another example is if, for example, a visitor arrives at a site from a search and then clicks on, for example, an internal link on that site with UTM parameters. This resulted in an assignment to the source and medium of the traffic according to the UTM parameters, and at the same time, two visits were generated. In GA4, one visit will be assigned to the organics.
In GA4, the organic traffic numbers are different in the result, usually lower.
GA3 and GA4 introduce organic traffic from search
What’s exciting and little known to many is that organic traffic reporting in Google Analytics – both old and new – has a methodology that could be clearer to us. Google Analytics overestimates organic traffic at the expense of direct traffic (direct sessions).
Google Analytics assigns the most recent source from the visitor’s non-direct session as the source of the visit. In practice, this means that if a visitor comes to the site from Google and then ten times directly, GA will report this as 11 visits from Google rather than a single direct session. It is one visit from Google and ten direct session visits.
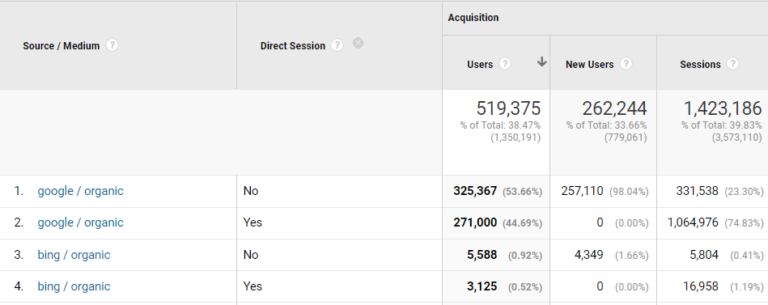
This phenomenon can significantly skew traffic, especially for media sites or sites where visitors return frequently. An example can be seen below. Roughly three-quarters of organic traffic came from direct traffic, although in a standard report, this is attributed to organics at the expense of direct traffic:
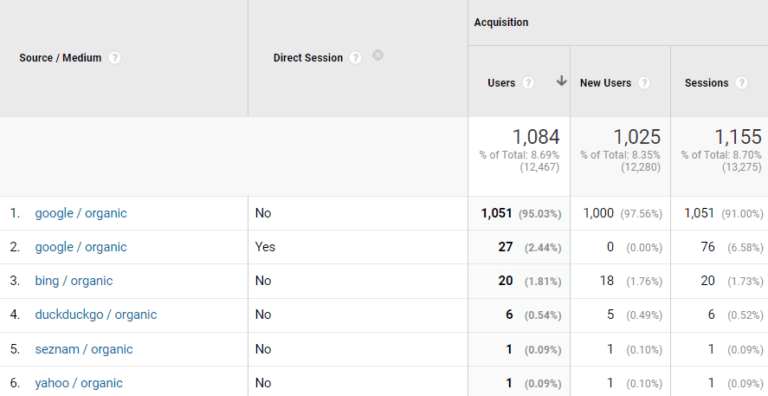
In contrast, sites that visitors rarely visit in this way do not show significant data disparity in this way, such as the one below:
How to look at data cleaned of this phenomenon in the old GA, Barbora Bošková describes on the Spotibo blog. I haven’t found a similar tutorial for GA4 yet.
Giving consent within the cookie bar reduces the numbers significantly
However, a correctly set cookie bar takes care of an even more significant drop in data. The level of consent to measure analytics data varies from case to case. The following things, in particular, have an impact on the level of consent:
- Cookie bar design. This is a comprehensive topic in itself. But briefly explained: it depends, for example, on whether it is possible to refuse the storage of non-technical cookies with one click – this increases the level of disagreement. It also depends on the options’ design (size, color, positioning, wording, etc.). How much does the cookie bar boots and force the visitor to interact with it?
- The type of site in terms of behavior. If it is a site where the visitor comes only briefly to read a brief piece of information and then leaves, they have little need to interact with the cookie bar and thus are less likely to give consent for measurement. The opposite is true for sites where the visitor needs to spend more time, fill out some forms, etc. – then there is a good chance that the visitor will interact with the cookie bar and thus give consent more often.
- Web content. If it is a site with content that is more sensitive to the visitor’s privacy, it will take more care to refuse consent to store non-technical cookies.
- Brand popularity. In the case of brands the visitor trusts or is among his favorites, he will also be more willing to consent to the storage of analytics or marketing cookies.
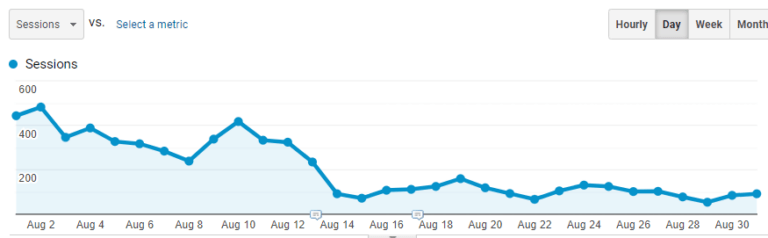
As a result, analytics tools such as Google Analytics may miss data at best 30% of the time, but commonly more than 70% of the time. An example of how traffic dropped after the cookie bar was deployed can be seen below:
Despite some risk of a fine, we won’t reveal the top secret that many sites have a cookie bar for show only, measuring everything at once regardless of the visitor’s interaction with it. Even any explicit disagreement by the visitor does not affect this.
Data modeling affects only a tiny proportion of websites.
GA4 responds to the mandatory cookie bar situation by being able to model data from visitors who have not consented. It does this with a level of (in)accuracy that doesn’t distort the overall data anymore than many other factors.
However, it’s surprising that the site needs relatively high traffic numbers for this modeling. Simply put, the site needs tens of thousands of visits per month. Unfortunately, only a minority of websites achieve this in our country.
If necessary, you can somewhat primitively “model” this data by adding to the recorded traffic the percentage of visitors who do not consent to the storage of analytics cookies.
Worse, the non-consent rate among visitors needs to be shown by Google Analytics 4. It can be seen in some tools that implement cookie bars on sites, possibly in the BigQuery database.
Google Search Console and Bing Webmaster Tools come to the rescue
For sites that do not qualify for data modeling by GA4 due to lower traffic, a simple solution is available in the form of tools that communicate search engines with sites.
It is important to note that Google dominates organic traffic from search. Still, we can also observe a particular share from search engines Bing, DuckDuckGo, Yahoo, Seznam, Ecosia, Baidu, Yandex, etc.
Most of those above provide some form of webmaster tools. In most cases, Google Search Console (GSC) is sufficient, and if we want to be more thorough, we can include Bing as well. (If we observe non-negligible shares from other search engines, webmaster tools from them.)
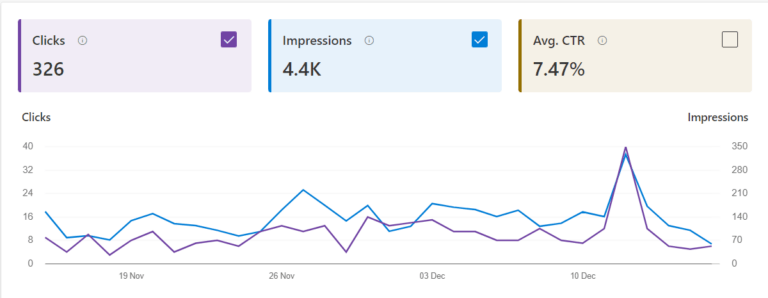
Both tools – from Google and Bing – indicate the number of clicks (Total Clicks) from these search engines directed to our site. In this case, a click can be considered the equivalent of a visit (session).
Summing the clicks from both tools gives us, in a simplistic way, the organic traffic from the search, which is balanced because it includes direct visits from visitors who came previously from organic search.
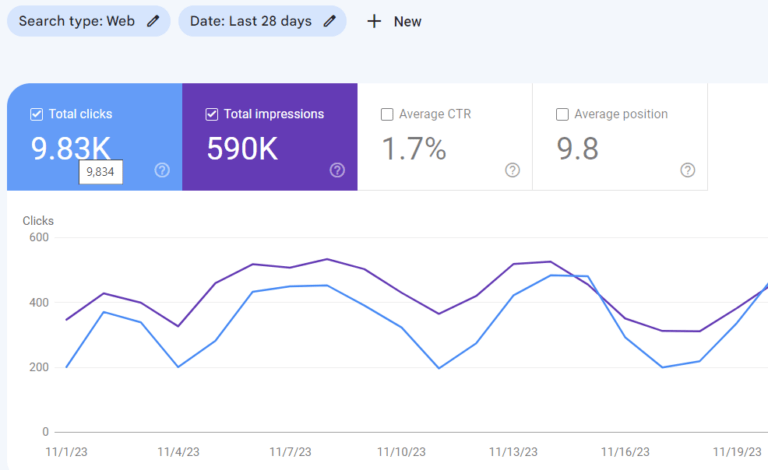
Preview from Google Search Console
Preview from Bing Webmaster Tools
We can see significantly lower click-through rates for websites, e.g., media sites, that suffer from the mentioned organic traffic distortion due to last indirect source attribution.
Conversely, we will see higher numbers for sites that suffer little from this phenomenon and have both a correctly implemented cookie bar and do not have data modeling.
Another cause creating the differences in numbers between GA and GSC is, for example, PDF files. PDF files cannot embed the GA measurement code and are invisible to GA. In contrast, GSC clicks on them from Google measurements.
A significant advantage of using Google Search Console to track organic traffic is that it is independent of cookie storage, so you don’t need permission to utilize it.
The disadvantage is that the data in Google Search Console has only been available for the last 16 months. This is sufficient for year-on-year comparisons but not for the more distant past.
The solution is, for example, to back up these figures for individual months once a year or to use a third-party tool such as Search Analytics for Sheets for a more comprehensive backup of GSC data.
Consistency is the most important
Regardless of how and who reports organic traffic from searches as a demonstration of SEO activity, the most important thing is data consistency. As I mentioned in the introduction, the deployment of the cookie bar and the move to GA4 have, in many cases, eroded this consistency.
It doesn’t make sense to compare organic visits from search (organic sessions) between GA3 and GA4. Nor between one of GA and GSC. Nor between data before and after cookie bar deployment. Doing so can only lead to very misleading results.
Those who reacted to these phenomena in time – they deployed GA4 more than a year before GA3 was turned off and had the bar asking for consent for analytics cookies already implemented as of February 1, 2022, when this obligation came into effect – they have already dealt with the data inconsistency somehow.
However, many sites only started to address GA4 deployment when they discovered that GA3 stopped measuring them. Many websites still do not have functional cookie bars and do not comply with the current legislation or, if not, with the opinion of the Office for Electronic Communications and Postal Services Regulation on obtaining consent under the provisions of Section 109(8) of Act No. 452/2021 Coll. on Electronic Communications.
These websites dealing with this inconsistency may just be waiting. For them, if they need to track organic search traffic and compare it year-on-year, the number of clicks in Google Search Console for individual months can be a convenient and straightforward way. They provided, of course, that they have been using this tool for over a year.
However, despite all the problems, GA4 can still be recommended as the primary source of data, as it provides a much more detailed overview of visitor behavior (interactive visits, number of conversions, purchases, etc.) and data from other traffic channels. GSC or Bing webmaster tools can be recommended as additional data for a broader development picture.