
Prepare Your E-commerce Project For the Top Season of the Year From a Google Shopping Perspective
Shopping campaigns are a vital source of traffic for e-shops today and account for a significant portion of the total turnover of most e-commerce projects. According to the data, up to 76.4% of the ad spend on Google’s search network is accounted for by shopping campaigns. This is the same for the upcoming top season of the year, which is crucial for many e-commerce projects.
In this article, you’ll find out what to think about before the top season regarding the above-mentioned shopping campaigns.
Product XML feed
Product XML feed forms an integral part of search shopping campaigns. However, from an e-commerce top-of-the-year perspective, there are some key areas to think about that can limit the overall performance of this type of campaign. What precisely should you look out for?
Unnecessarily rejected products
The long-term goal is to have as many approved products as possible for advertising in Google Shopping. Therefore, before the start of the top season, look at the data in Google Merchant Center in the Diagnostics section, where you can see the percentage of rejected products out of the total number of products.
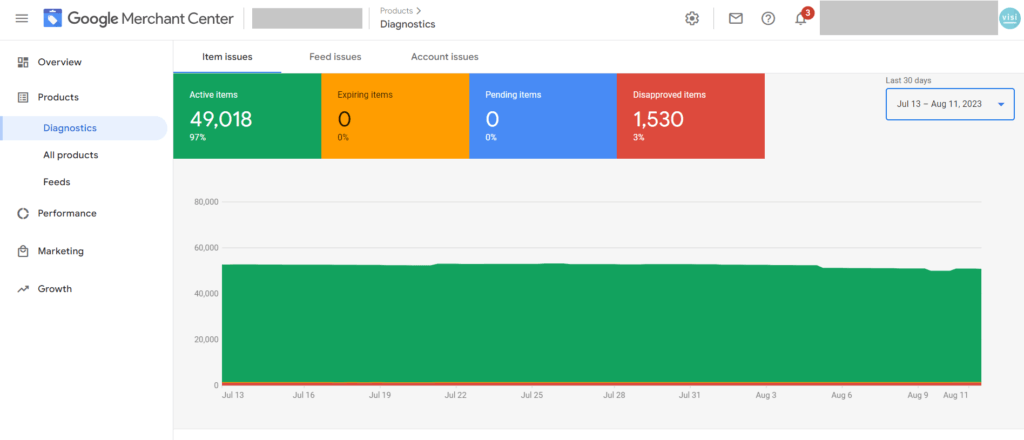
As you can see in the figure above, the rejection rate is at 3%, which is generally natural. However, besides the proportion, what is important is the total volume, which in this case is up to 1530 products. In such cases, but also assuming you have a higher share, you must keep track of the reasons for rejecting the products. This information can be found at the bottom of the “Diagnostics” section, where it is described for which reason or for which problem the given amount of products is rejected.
The most common reasons for product rejection include:
- Missing values in the feed – e.g., here it can be the values of the image_link parameters,
- products in the feed do not contain a landing page for mobile devices,
- products in the feed do not include a landing page for desktop,
- Product images are too small – it is recommended that product images should be at least 100 x 100 pixels. For the fashion segment, the recommendation is 250 x 250 pixels,
- and many others.
I also recommend doing a thorough audit of the product feed before the start of the primary e-commerce season to minimize potential problems in the long run. During peak season, keep an eye on Google Merchant Center and the status of product rejections, especially if you rotate merchandise heavily.
Communicating discounts
Of course, the last quarter of the year includes discounts. Your goal, especially in the run-up to Christmas or during Black Friday, is to communicate these discounts to potential customers as much as possible and thus exploit their full potential.
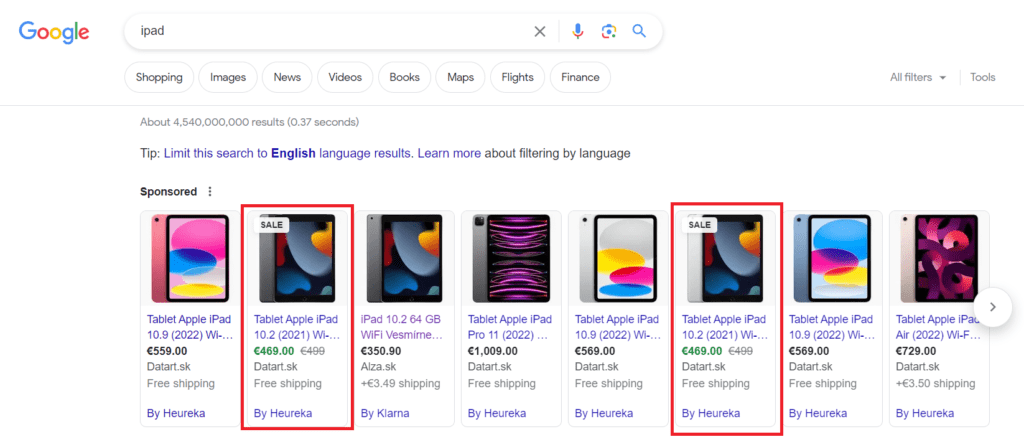
Naturally, this is also the case in Google Shopping, where you can easily communicate the discounted price using the essential elements sale_price or sale_price_effective_date. In practice, this looks like this:
If your product XML feed doesn’t contain a sale_price element, which replaces the price element (i.e., the standard price) when the ad is displayed, incorporate it before the top season. An excellent addition to the essential sale_price part is the sale_price_effective_date mentioned above, which you can use to define the effective date of the sale price.
Price competitiveness
The economic situation has affected everyone in some way, especially inflation. Someone more, someone less. Either way, in terms of purchasing behavior, pricing and working with prices are extremely important, as the data in the figure below confirms.
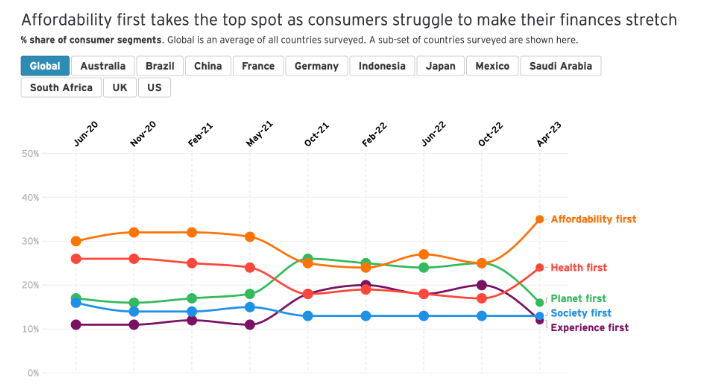
According to the Future Consumer Index study by EY, consumers are more prone to affordability than in previous years.
What does this imply in terms of Google Shopping? There is no one-size-fits-all answer for all e-commerce stores; it depends on your capabilities and business model. But it would be best if you naturally tried to maximize price competitiveness.
An excellent way to approach this is with data in Google Merchant Center, where you can track how you’re doing against your competitors in the “Price competitiveness” report:
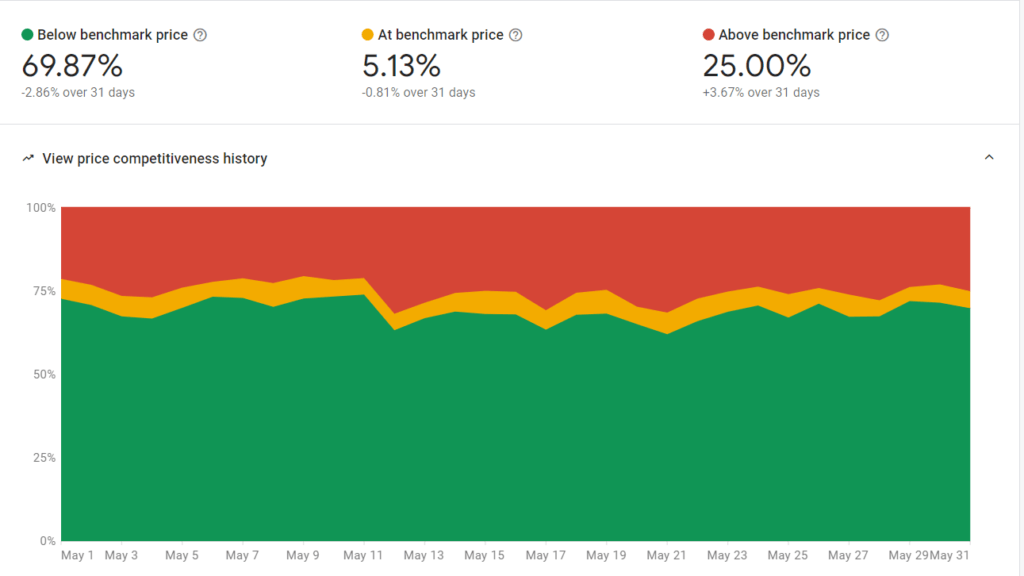
In this case, the goal is to be at least at the benchmark level (yellow line), ideally below the market benchmark. The great advantage of this price competitiveness report is that you can work with data at the level of specific products or product categories. In practice, this data can also be used to segment the campaigns themselves, where you can focus the bulk of the budget on products below the benchmark, for example, or exclude products above the market benchmark from advertising altogether.
Analysis of previous periods
If you have been campaigning extensively in the previous year(s), you must analyze historical data in as much detail as possible. What you should focus on:
- Trends in the development of orders,
- Trends in key performance indicators/metrics,
- Product/product category performance,
- Campaign performance.
Order trend and conversion rate
In this case, we need to trace the fundamental data and vertical evolution from a conversational perspective. When looking at the order development trend, consider how you have worked with the budget during the period.
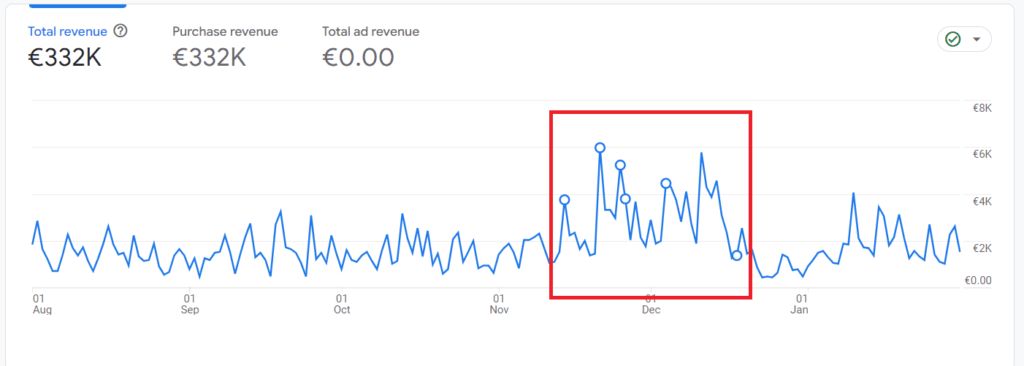
Graph of order trend and conversion rate
The trend in order value
The trend of key performance indicators/metrics
In general, the vertical graph above, or graphs, should help you identify your customers’ behavior in past periods, and you should also plan for the next season based on this factor.
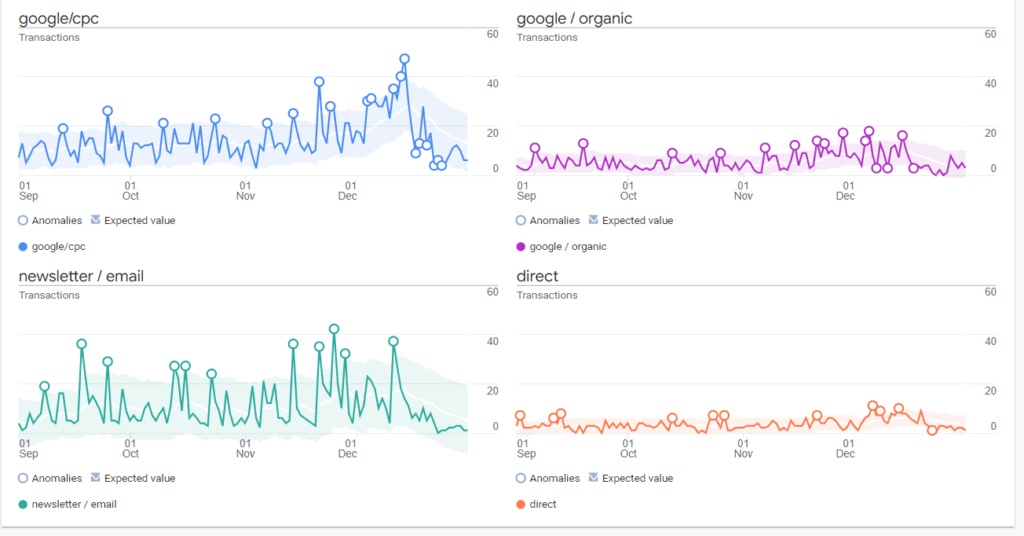
However, the above data should always be elaborated and looked at a little deeper for completeness. That is, analyze the performance of the carrier channels in a given period, as I mentioned above, and also look at the trend of budget utilization in a given period, etc. A good help for a quick overview is the Explore section in Google Analytics 4, where you can look at the top sources and compare quite easily the vertical development of the given traffic sources:
Product/product category performance
An essential part of overall planning for the last quarter is analyzing historical product performance data. There are several approaches to looking at the data. It all depends on how many products you advertise, your segment, your marketing mix, the share of each traffic source in your e-shop, and so on.
In general, however, it’s a good idea to analyze product data first at all traffic sources, i.e., at the level of the entire e-shop. Then, you can explore, for example, how the products performed in Google Shopping. Google Analytics 4 can also help you in this area (assuming, of course, that you had it fully set up a year ago).
Campaign performance
The last but very important area to focus on is the campaigns themselves. In this case, you also need to look at the data involved, for example:
- Performance of creatives,
- the performance of specific channels,
- the performance of campaign types.
Of course, the campaign objective needs to be considered for each campaign type. For an outreach campaign, look at metrics such as cost per thousand impressions (CPM); for conversion campaigns, look at conversion ratio or PNO/ROAS. If you also want to evaluate the performance of creatives retrospectively, focus on metrics like CTR (click-through rate).
Conclusion
Honest preparation for peak season is a crucial success factor. Be sure to review and replenish your product feed this year and analyze historical data in detail. It takes effort and attention to the point, but getting it right can ultimately lead to a successful season for your e-commerce project.