
Cluster Analysis: What is It, And How Can it be Used in Marketing?
The tools for analyzing and evaluating individual marketing activities have moved in recent years from primary to machine learning tools that can, for example, extract patterns from raw data or predict future patterns. Basic machine learning methods include cluster analysis, often used to divide data into multiple sets based on standard features that need to be clarified to the analyst in advance.
In this article, we’ll look at how cluster analysis works, how it can help in marketing, and how it is most commonly used in marketing practice.
Marketing vs. digital marketing
Over the last 30 years, the marketing world has changed beyond recognition. Traditional marketing techniques now work together with digital ones, which developed in the mid-1990s. These new digital methods emerged with the birth of the Internet. Using them, we can now target and reach a targeted group of customers much more quickly.
Before the advent of the Internet in the 1990s, the best marketing campaigns were launched through television, radio and traditional forms such as posters. Of course, these tools still work today and can still deliver conversions from a marketing perspective. The problem with these media is that they are very difficult to evaluate, optimise and target to selected groups of customers.
All digital strategies and marketing techniques work on the proper data. Data is (or should be) the source of most marketing decisions. It’s the basis for evaluating every experiment in the digital world, identifying if and where they have flaws, correcting those flaws, and optimizing campaigns.
Data analytics has undoubtedly become an essential part of marketing today, and anyone working as a marketer should look at data in this way.
How can data analytics help in marketing?
The term data analytics is comprehensive. Data is anything we can measure and use to our advantage, whether measuring the amount of time a person spends working on a task or advanced data science models that we can use to predict future scenarios with some probability.
In marketing, data analytics helps in decision-making, customer segmentation, or campaign optimization. By analyzing large volumes of data, companies can identify and understand their customer’s behavior, preferences at a deeper level or estimate future trends. In this way, they can, for example, modify their products or services, adjust the message in marketing campaigns or allocate their budget correctly to get the highest return on investment.
What is cluster analysis?
One of the advanced segmentation methods (not only) in marketing is cluster analysis. Cluster analysis is a type of machine learning that allows a computer (with human help) to segment data based on hidden, internal similarities correctly. This is where its power lies: cluster analysis needs almost no input from data analysis. Thanks to this, any human influence on the results can be ruled out.
The primary purpose of cluster analysis is to create multiple groups (clusters) from the entire dataset, containing observations that are as similar to each other as possible or have as many similar characteristics as possible. The individual clusters containing these observations should resemble each other as little as possible. More technically, intra-cluster variance is minimized while inter-cluster variance is maximized.
Different types of cluster analysis
Several types of cluster analysis are primarily used in machine learning problems. The best-known are:
- Hierarchical Agglomerative Clustering – in which each observation starts as a separate unit, and at the end of the analysis (when the result cannot be further adjusted), we have created several clusters containing these observations.
- Hierarchical Divisive clustering – is the exact opposite of agglomerative cluster analysis in that, at the beginning, all observations are placed in one large cluster. In contrast, at the end of the analysis, we have divided this large cluster into several smaller but precious clusters.
- K-means cluster analysis – The most widely used type of analysis is designed to group individual observations into corresponding clusters based on the distance of each observation from the centroid (midpoint).We will describe this type of analysis later in this article.
K-means cluster analysis
In Figure 1, we can see a graphical representation of the K-means cluster analysis approach. Initially, we have some observations displayed in 2D space (it can be anything, for example, your customers). The cluster analysis algorithm found similarities between observations in this area based on their distance from the centroids. It grouped these observations into three clusters (the number of clusters had to be determined in advance).
For a better understanding, the Y-axis shows, for example, the number of conversions on a web page, and the X-axis shows the time unit in minutes. We can see that the green cluster contains the people who spent the least time on the website but made a relatively high number of conversions. On the other hand, the red cluster contains visitors who spent more time on the website but made a small number of conversions. The blue cluster consists of people who have been on the site for a more extended period but have also made a relatively high number of conversions.
Once we can segment our site visitors, we can target different groups with different campaigns. For example, Blue will see more discount campaigns to reduce their average conversion time, and so on.
Of course, the above example is simplified for a better understanding; the accurate K-means clustering can extract much more complicated relationships between observations that must be clarified to the average person.
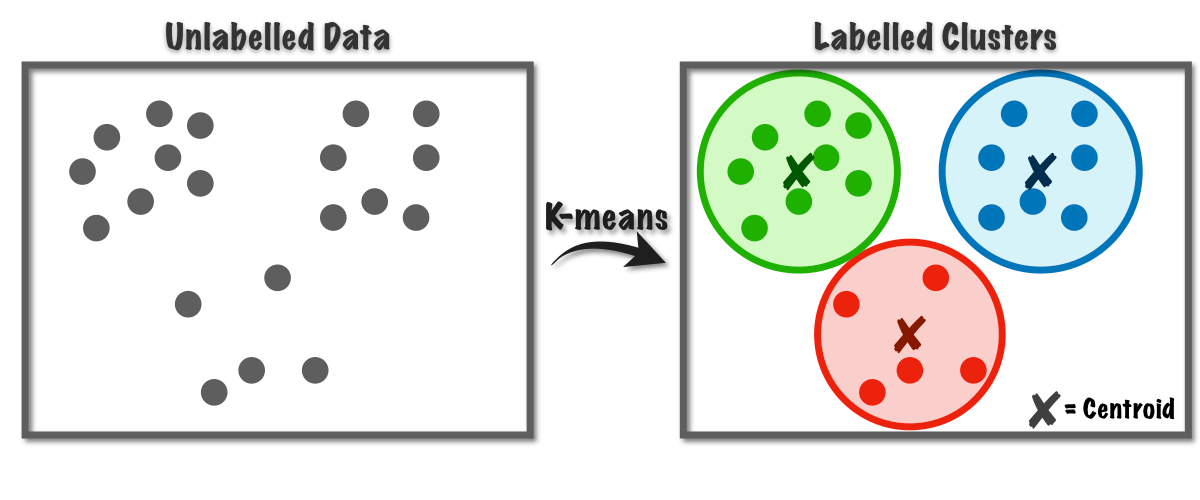
Figure 1: K-means cluster analysis process
Source: https://miro.medium.com/v2/resize:fit:1200/1*rw8IUza1dbffBhiA4i0GNQ.png
In K-means cluster analysis, the analyst must set the optimal number of clusters. This can be done either by using one’s judgment and understanding of the problem being solved or by using statistical methods.
- Segmentation into clusters is a relatively simple concept, depending on the nature of our problem. For example, if we know that we need to split customers into two clusters because we will create two campaigns, we don’t need to do any calculations. It is possible to set only two clusters immediately after the algorithm starts.
- If we don’t know in advance how many categories we want to divide our customers into, we can help with the WSS method. WSS (within the sum of squares) is a statistical procedure showing the number of optimal clusters to create on a graph. It works on decreasing returns on total variability, so any additional cluster we add beyond the optimal number will need more benefit to make it worth including in the analysis. Therefore, we only select the optimal number of clusters for which variability is still at the optimal level.
Use of cluster analysis in marketing praxis
This type of analysis is beneficial when we have a large dataset and we want to split it into multiple smaller sets so that these sets contain relevant, similar observations. In the following paragraph, we will look at the most common cases where cluster analysis is used in marketing practice:
- Recommendation algorithms, such as those on the Netflix platform, operate based on cluster analysis, which they use primarily to segment their customers and to recommend selected movies or series. Series and movies are categorized based on their genre and then instructed to segment groups of users.
- Product segmentation is also a form of this analysis in marketing practice. Based on this segmentation, a marketer can determine which products are the best and the worst performers. Based on this information, a better decision can be made about using the marketing budget.
- Customer segmentation is the most common use of cluster analysis, whereby it involves segmenting targeted customers based on selected attributes such as the number of products purchased, time spent on the online shop, and total purchase price. Once customers are segmented, the retailer can create special offers for each segment based on the characteristics of each cluster.
- Cross-selling and upselling, otherwise known as basket analysis, are excellent tools when a salesperson can see the relationships between products purchased in the past. Based on these relationships, a cross-sell or upsell offer can be added to individual products to increase sales. Cluster analysis is not primarily used for basket analysis. When cluster analysis is combined with other algorithms, it can provide high added value to the overall result.
- A/B testing is primarily performed randomly from the overall data set. In this case, cluster analysis can divide the dataset into smaller clusters. It is easier to experiment and test on these clusters, where each cluster is unique in some way, using A/B testing.
In the example below, you can see how we defined over-performing products from ordinary ones by multiple attributes using cluster analysis for one of our e-commerce clients. Afterward, we used this data to optimize product campaigns.
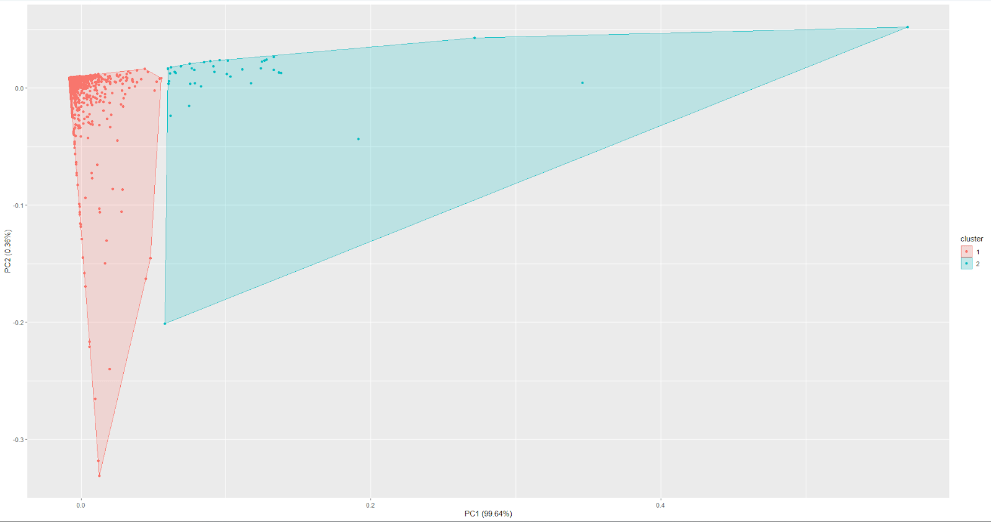
A graphical interpretation of the clusters can be seen in Figure 2.
Conclusion
Cluster analysis is one of the many machine-learning tools that can be used in multivariate data analysis. It is a method in which one large data set can be turned into several smaller sets containing similar observations. Based on it, different types of numerical data can be segmented, and this segmentation can be used in further analysis.